
The 23 most polluted roads in Telford and Newport ranked by air quality
Here are the latest figures for air quality in Telford and Wrekin.

Air pollution has a significant impact on health. In fact, it now poses the largest environmental risk to public health in the UK, according to Public Health England.
Long-term exposure to air pollution can lead to chronic conditions such as cardiovascular and respiratory diseases as well as lung cancer.
It is therefore imperative to know what the air quality is like in your neighbourhood.
We have looked at the latest data available to show which roads in Telford and Wrekin have the worst recorded air pollution.
None of the places featured breached the UK limit for nitrogen dioxide (NO2) of 40 micrograms (µg)/m3.
However, only two were under the World Health Organisation’s lower guideline for clean air of 10 µg/m3 of NO2.
The figures for the list below, which is ordered from most polluted to least, have been taken from the 2024 Air Quality Annual Status Reports published by Telford & Wrekin Council. The data is from 2023.
Mill Bank, Wellington
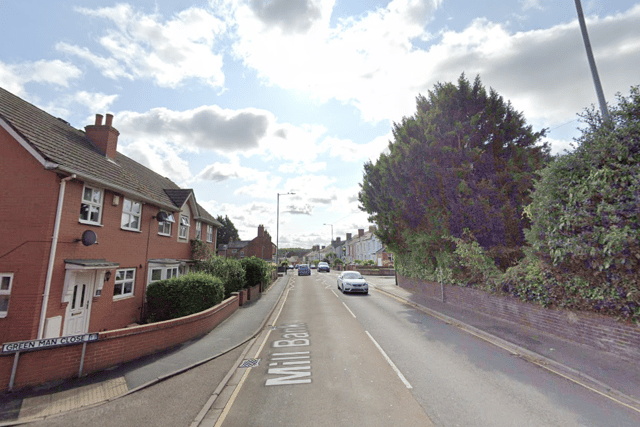

In 2023, the annual mean concentration of NO2 recorded in Mill Bank, Wellington, was 30.9 µg/m3, which is more than three times WHO's recommended limit. This is the highest figure recorded in Telford and Wrekin.
Watling Street, Wellington
In 2023, the annual mean concentration of NO2 recorded in Watling Street, Wellington, just outside the Swan, was 25.3 µg/m3.
Watling Street/Regent Street, Wellington
In 2023, the annual mean concentration of NO2 recorded at Watling Street/Regent Street, Wellington, was 23.8 µg/m3.
A41, near Newport
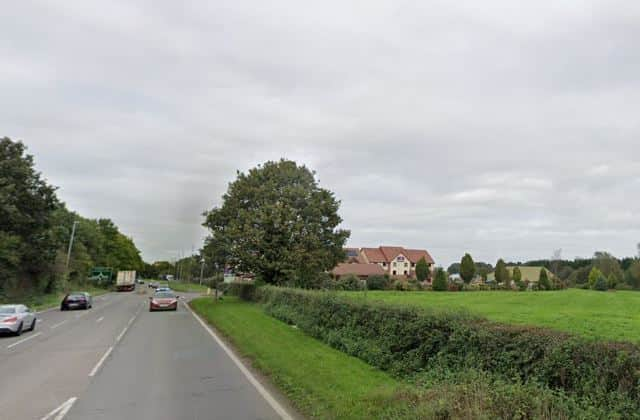
In 2023, the annual mean concentration of NO2 recorded at the A41 by Newport was 22.6 µg/m3, which is just double WHO's recommended limit.
Cockshutt Road/Station Hill, Oakengates
In 2023, the annual mean concentration of NO2 recorded in Cockshutt Road/Station Hill, Oakengates, was 21.4 µg/m3.
Haybridge Road, Hadley
In 2023, the annual mean concentration of NO2 recorded in Haybridge Road, Hadley, was 20.9 µg/m3.
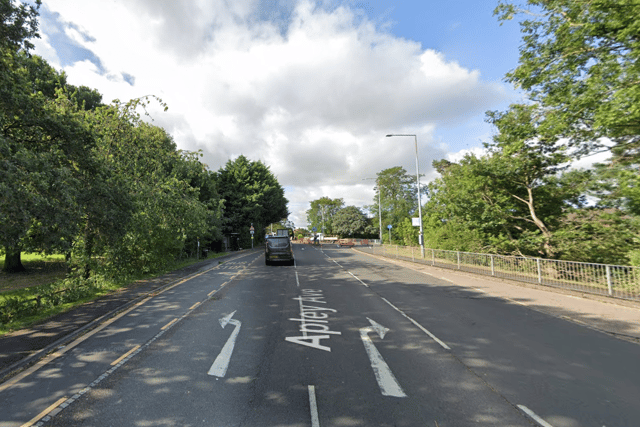
In 2023, the annual mean concentration of NO2 recorded in Apley Avenue, Wellington, was 20.6 µg/m3.
Jubilee Terrace, Trench Road
In 2023, the annual mean concentration of NO2 recorded in Jubilee Terrace, Trench Road, was 18.3 µg/m3.
Ironbridge Road, Madeley
In 2023, the annual mean concentration of NO2 recorded in Ironbridge Road, Madeley, was 18.1 µg/m3.
Stafford Road, Oakengates
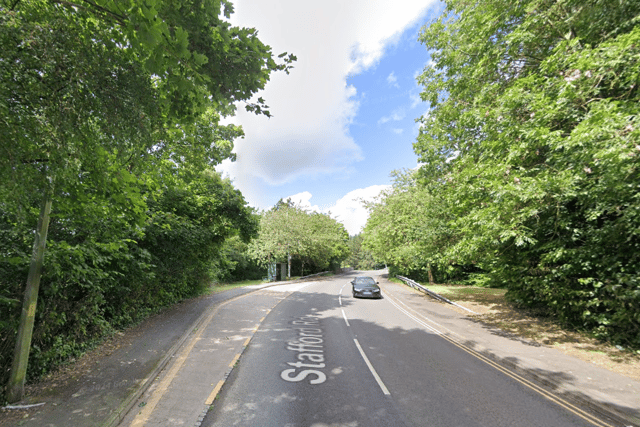
In 2023, the annual mean concentration of NO2 recorded in Stafford Road, Oakengates, was 16.9 µg/m3.
Grainger Drive/Kingfisher Way, Apley
In 2023, the annual mean concentration of NO2 was recorded in Grainger Drive/Kingfisher Way, Apley, was 16.6 µg/m3.
Wellington Road (A518)/Barrack Lane, Newport
In 2023, the annual mean concentration of NO2 recorded in Wellington Road (A518)/Barrack Lane, Newport, was 15.8 µg/m3, which is one and a half times WHO’s recommended limit.
Shifnal Road, Priorslee
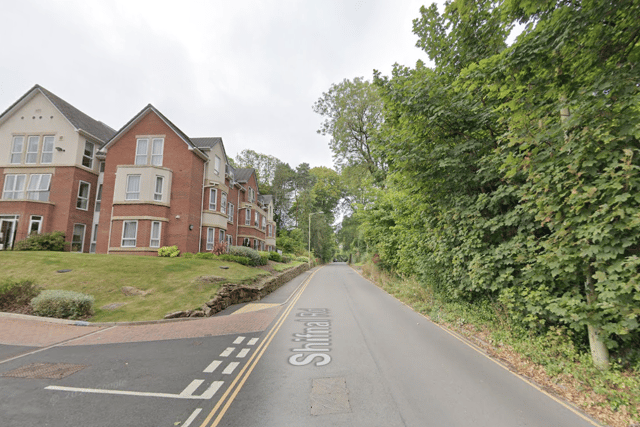
In 2023, the annual mean concentration of NO2 recorded in Shifnal Road, Priorslee, was 14.6 µg/m3.
Ryebank Road, Ketley Bank
In 2023, the annual mean concentration of NO2 recorded in Ryebank Road, Ketley Bank, was 14.5 µg/m3.
Chapel Terrace, Oakengates
In 2023, the annual mean concentration of NO2 recorded in Chapel Terrace, Oakengates, was 14.2 µg/m3.
Garfield Road, Overdale
In 2023, the annual mean concentration of NO2 recorded in Garfield Road, Overdale, was 13.6 µg/m3.
Priorslee Avenue, Priorslee
In 2023, the annual mean concentration of NO2 recorded in Priorslee Avenue, Priorslee, was 12.7 µg/m3, which is just higher than WHO's recommended limit.
Wellington Road, Newport
In 2023, the annual mean concentration of NO2 recorded in Wellington Road, Newport, was 12.2 µg/m3, which is just higher than WHO's recommended limit.
Southwater Square

In 2023, the annual mean concentration of NO2 recorded in Southwater Square was 11.4 µg/m3, which is just higher than WHO's recommended limit.
Downmead, Hollinswood
In 2023, the annual mean concentration of NO2 recorded in Downmead, Hollinswood, was 11.2 µg/m3, which is just higher than WHO's recommended limit.
Berkeley Close, Priorslee
In 2023, the annual mean concentration of NO2 recorded in Berkeley Close, Priorslee, was 11.1 µg/m3, which is just higher than WHO's recommended limit.
Newdale/Lawley Junction
In 2023, the annual mean concentration of NO2 recorded in Newdale/Lawley Junction was 9.6 µg/m3. This is the second lowest figure recorded across Telford & Wrekin.
Bridge Road, Horsehay
In 2023, the annual mean concentration of NO2 recorded in Bridge Road, Horsehay, was 8.9 µg/m3. This is the lowest figure recorded by Telford & Wrekin Council and under WHO's recommended limit.
Comment Guidelines
Iconic Media encourages reader discussion on our stories. User feedback, insights and back-and-forth exchanges add a rich layer of context to reporting. Please review our Community Guidelines before commenting.