New map charts Shropshire's ups and downs
Do you live in an area that is on the up, or are you experiencing that sinking feeling?
You can now find out thanks to an interactive map which shows how the ground beneath our feet is shifting – or not, as the case may be.
Environmental consultancy firm Geomatic Ventures has produced the first satellite-based radar survey to show which parts of Britain are going up or down with millimetre precision.
Perhaps thankfully, the map, shows that Shropshire, by and large, enjoys a fairly stable landscape.
But there are some areas that have seen rises and falls over the time that the data was gathered between October 2015 and October 2017.
Mid Wales, though, has seen significant subsidence over that time, with several areas around the Berwyn mountain range showing noticeable falls.
By contrast, an area around Torrin Drive, in Shrewsbury, was shown to have risen considerably over the same period, as did a farmer's field in Middleton, near Ludlow.
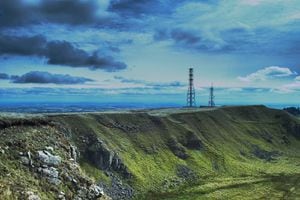
One of the biggest risers is the area around Titterstone Clee Hill, where parts of the landscape have been growing by about 8mm – or one-third of an inch – each year.
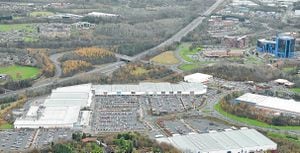
Parts of the Forge Retail Park in Telford have fallen by several millimetres, the map shows.
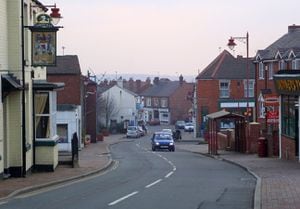
The former mining village of Highley shows considerable variety, with parts of it showing small falls, while neighbouring spots have risen by up to a third of an inch per year.
Andy Sowter chief technical officer of Geomatic Ventures, said it was not unusual to see areas of slight uplift or subsidence, particularly in former mining areas.
"Very often, where there's been an old coal-mining area, when they close the pit the ground swells up," he says.
"It's caused by groundwater returning to the area."
But other former coal-mining areas, such as Madeley, show little or now deformation.
Part of the former Ironbridge Power Station has also risen, but that could be down to something as simple as a rise in the coal storage heaps, Mr Sowter said.
He said it was difficult to pin down the precise causes of the changes without knowing more about the area and its background.
But he said changes in relief did not necessarily represent a problem for the areas concerned.
The data was compiled by locating two probes 400 miles above the earth's surface, which fired radio waves at the ground and measured how long it took them to bounce back.
This was used to produce a "heat map", which shows how some parts of the country are sinking, while others are rising.
Shropshire and mid-Wales is largely coloured in neutral green, although there are significant areas shaded yellow which indicate minor subsidence.
One of the biggest risers in the country is the village of Willand in Devon, which has been rising by just over three-quarters of an inch a year, which means it could eventually become the highest peak in the country – if the trend continues for 44,000 years.
The full map can be viewed on the website mangomap.com